Multiple Choice
Alvin's preferences for good X and good Y are shown in the diagram below. 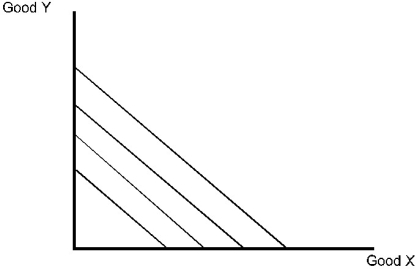 Figure 3.1
-Based on Figure 3.1, it can be inferred that:
Identify the components and determinants of taxable income.
Recognize the characteristics of progressive, regressive, and proportional tax systems.
Understand how government revenues are generated and how they relate to expenditures in education and defense.
Evaluate the role of taxes in financing public goods and services.
Definitions:
Related Questions
Q46: In Table 5.3, the standard deviation is<br>A)
Q57: The market for used cars in a
Q82: If X and Y are perfect substitutes,
Q86: Refer to the indifference curve in Figure
Q90: Given the information in Figure 18.1, the
Q94: Ms. Moneynickel has a monopoly in oil
Q108: Refer to Table 5.3. Rank the doctor's
Q117: A consumer's demand for CDs can be
Q117: The professional baseball league on planet Economus
Q167: Bill's utility function takes the form U(I)