 Figure 11.3.2
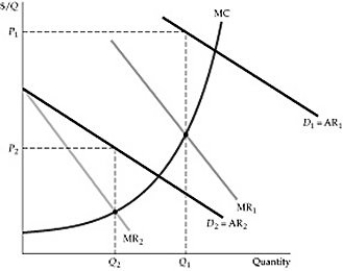
-Refer to Figure 11.3.2 above. This figure is a representation of:
Definitions:
Marginal Cost Curve
A graphical representation of the change in total production costs with respect to the change in the quantity produced.
Constant
A fixed value that does not change in mathematical equations or scientific experiments, often representing fundamental principles or conditions.
Long-run Cost Curve
A graphical representation of the costs incurred by a firm to produce different levels of output in the long run when all inputs are variable.
Production Costs
The total expense incurred in manufacturing a product or providing a service, including materials, labor, and overhead costs.
Q37: When government intervenes in a competitive market
Q38: The following diagram shows marginal value and
Q43: Owners and managers:<br>A) must be the same
Q59: What is the difference between the corporate
Q74: We may be tempted to determine the
Q75: Quasar Corporation is set to release its
Q90: An industry analyst observes that in response
Q133: An oligopolistic situation involving the possible creation
Q140: Refer to Figure 9.1.1 above. Suppose the
Q140: Two firms in a local market compete