 Figure 5.2.1
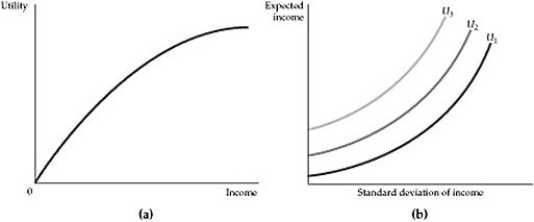
-Refer to Figure 5.2.1 above. Because risk is undesirable, the greater the amount of risk, the greater the expected income needed to make the individual equally well off. Which of the two graphs best describes this assertion?
Definitions:
Interest Rate
The cost of borrowing money or the return on savings, usually expressed as a percentage.
Interest Rate
The percent of principal charged by the lender for the use of its money or the rate earned on deposited funds.
Revenues
Revenues are the total amount of money generated by a company from its business activities, such as the sale of goods or services, before any costs or expenses are deducted.
Interest Rate
The interest rate is the cost of borrowing money or the return earned from lending money, typically expressed as a percentage of the principal amount per year.
Q3: Refer to Figure 2.4.1. Between two points
Q7: When facing a 50% chance of receiving
Q12: Suppose that the demand for artichokes (Q<sub>a</sub>)
Q21: Consider the following statements when answering this
Q51: Refer to Figure 7.4.1 above. An increase
Q57: Suppose that the resale of tickets to
Q81: The discussion of Figure 2.2 in the
Q117: Ronald's Outboard Motor Manufacturing plant production function
Q120: Calculate the expected value of the following
Q148: The squishy industry is competitive and the