Multiple Choice
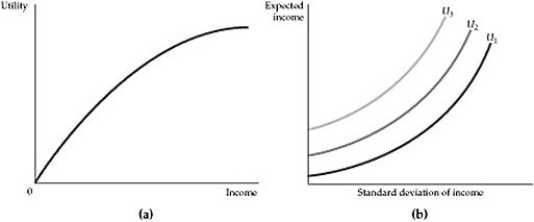 Figure 5.2.1
-Refer to Figure 5.2.1 above. Because risk is undesirable, the greater the amount of risk, the greater the expected income needed to make the individual equally well off. Which of the two graphs best describes this assertion?
Definitions:
Related Questions
Q12: A production function defines the output that
Q52: Refer to Table 5.1. Expected income for
Q65: An industry in which sales tend to
Q79: Refer to Figure 4.1.2. From the information
Q82: The individual pictured in Figure 5.2.3:<br>A) must
Q98: Example 2.2 in the textbook explains the
Q100: An isocost line reveals the<br>A) costs of
Q101: The cross-price elasticity of demand refers to:<br>A)
Q120: Joe's Organic Cereal Company produces granola breakfast
Q120: Refer to Figure 8.4.3 above. The firm