 Figure 5.2
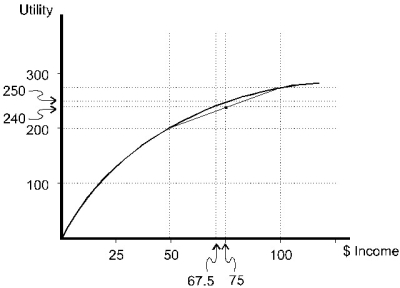
-When facing a 50% chance of receiving $50 and a 50% chance of receiving $100, the individual pictured in Figure 5.2
Definitions:
Unit Elasticity
Unit elasticity refers to a situation where a change in the price of a good or service results in a proportionally equal change in the quantity demanded or supplied, indicating a unitary elasticity of demand or supply.
Maximum Total Revenue
The highest possible earnings that a firm can achieve from the sale of goods or services, typically found by optimizing price and quantity sold.
Price
The price necessary to acquire a good or service.
Demand Curve
A graphical representation of the relationship between the price of a good or service and the quantity demanded by consumers.
Q26: A plant uses machinery and waste water
Q40: The fact that Alice spends no money
Q49: Refer to Scenario 5.2.Which of the following
Q50: Calculate the expected value of the following
Q66: Imposition of an output tax on all
Q70: The snob effect corresponds best to a<br>A)negative
Q71: Consider the following statements when answering this
Q75: The curve in the diagram below is
Q109: The concept of a risk premium applies
Q109: The cost of producing 600 small fiberglass