Exhibit 6-29 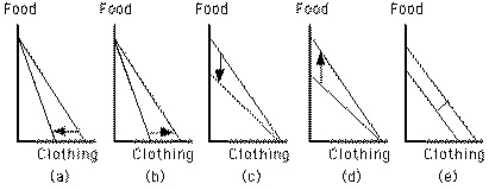 Which graph in Exhibit 6-29 shows a decrease in the price of food?
Definitions:
Dollars Per Unit
A unit cost measure representing the price or cost of a single item or measure of goods or services.
Elasticity of Product Demand
A measure of the responsiveness of the quantity demanded of a product to changes in its price.
Elasticity of Resource Demand
The measure of how much the quantity demanded of a resource changes in response to a change in its price.
MRP
Marginal Revenue Product, which is the additional revenue generated from employing one more unit of a resource.
Q13: If a decrease in the price of
Q19: On which of the following goods would
Q28: Suppose the cross-price elasticity of demand between
Q29: Opportunity cost is measurable only when prices
Q35: Indifference curves in a consumer's indifference map
Q79: If the demand for a product is
Q101: The cost of consumption has two components:<br>A)the
Q143: If the tea harvest is bad in
Q180: A successful advertising campaign would likely<br>A)increase price
Q189: For a person who owns and operates