Multiple Choice
Use the following to answer question: 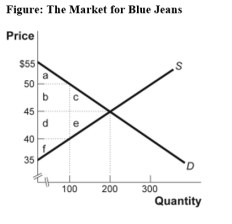
-(Figure: The Market for Blue Jeans) Use Figure: The Market for Blue Jeans.The government recently levied a $10 tax on the producers of blue jeans.What area or areas in the graph identify deadweight loss?
Definitions:
Related Questions
Q20: If the price of emergency visits to
Q76: The _ rate applies to an additional
Q116: The university hopes to raise more revenue
Q128: (Figure: Estimating Price Elasticity)Use Figure: Estimating Price
Q137: (Figure: The Market for SUVs)Use Figure: The
Q155: (Scenario: The Market for Good X)Use Scenario:
Q179: Joan loves sushi.Her first piece of sushi
Q183: A maximum price set below the equilibrium
Q215: The burden of a tax on a
Q243: The evidence suggests that federal taxes in