Use the following to answer question: 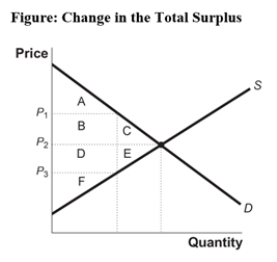
-(Figure: Change in Total Surplus) Look at the figure Change in Total Surplus.Which areas represent the change in total surplus when the price falls from P1 to P2?
Definitions:
Security Market Line
A line graph that represents the relationship between risk (beta) and the expected return of the market and various securities.
Q2: An agricultural market price support policy establishes
Q34: (Figure: Change in Total Surplus)Look at the
Q57: Mountain River Adventures offers whitewater rafting trips
Q101: In New York City there are more
Q108: "In 2008,air travel decreased substantially,despite significant reductions
Q109: (Table: The Market for Taxi Rides)Use Table:
Q126: (Table: Choice with Uncertainty)Use Table: Choice with
Q142: A farmer finds that when he produces
Q153: If total revenue goes down when the
Q197: If consumer tastes for electric cars increase