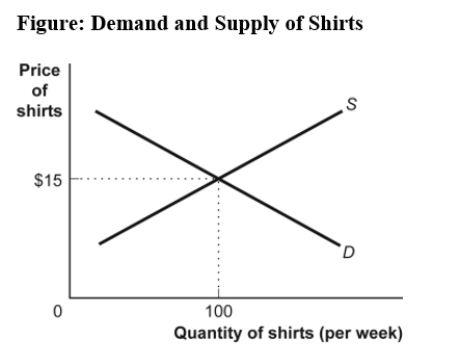
Use the following to answer question: 
-(Figure: Demand and Supply of Shirts) Use Figure: Demand and Supply of Shirts.In the graph,if the line labeled D shows how many shirts per week will be demanded at various prices,then it is clear that,as the price of shirts falls:
Definitions:
Q36: (Figure: Cold Drinks Sold and Temperature)Use Figure:
Q50: A scatter diagram shows:<br>A)how far apart dependent
Q89: (Table: Choice with Uncertainty)Use Table: Choice with
Q98: (Figure: Consumer and Capital Goods)Use Figure: Consumer
Q101: (Figure: Production Possibility Frontier)Use Figure: Production Possibilities
Q114: Which U.S.welfare program is a monetary benefit
Q117: (Scenario: Buying Shares)Use Scenario: Buying Shares.The probability
Q120: (Table: Amy's Utility Function)Use Table: Amy's Utility
Q134: In the factor market,firms buy goods and
Q290: On any given production possibility frontier,we see