Use the following to answer question: 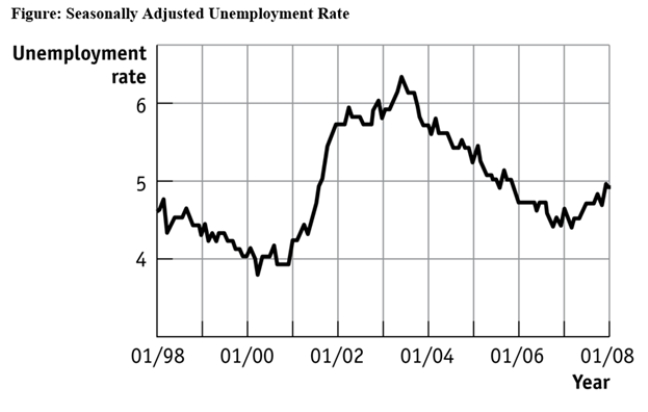
-(Figure: Seasonally Adjusted Unemployment Rate) Use Figure: Seasonally Adjusted Unemployment Rate.The distance between each labeled point on the horizontal axis is one year,and the distance between each labeled point on the vertical axis is one percentage point of unemployment.Using this graph,the unemployment rate was at its lowest point (in the time window) shown in _____ and at its highest point (in the time window shown) in _____.
Definitions:
Directives
Instructions or orders given by someone in authority, which are to be followed by others.
Goals
The objectives or desired outcomes that an individual or organization aims to achieve within a specific timeframe.
Objectives
Specific, measurable goals set by a business or individual to achieve desired outcomes.
Measurable Performance
The aspect of performance that can be quantitatively assessed or evaluated through specific metrics or indicators.
Q4: A way in which health care in
Q11: (Table: Value of the Marginal Product of
Q44: Suppose Poland is producing on its production
Q47: If an economy has to sacrifice only
Q55: To ensure that low- and middle-income families
Q71: A simplified version of reality that is
Q116: A popular choice for the MOST important
Q138: In the U.S.labor market,Hispanic men have the
Q155: (Figure: Guns and Butter)Use Figure: Guns and
Q203: Economists disagree more over normative economics than