Use the following to answer question: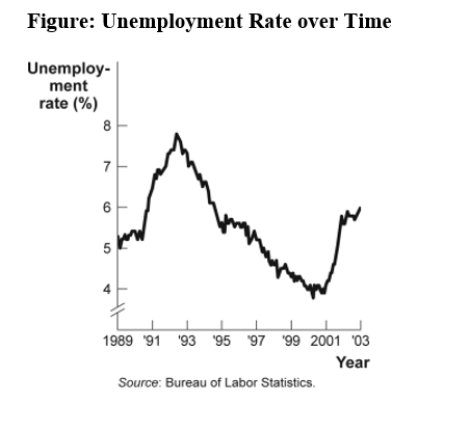
-(Figure: Unemployment Rate over Time) Look at the figure Unemployment Rate over Time.In the time-series graph,as we move from the beginning of 2001 to the beginning of 2003,we see that the unemployment rate has _____ from approximately _____ to approximately _____.
Definitions:
Q4: People who want to reduce the risk
Q14: (Figure: Omar's Production Possibilities)Use Figure: Omar's Production
Q41: Studies of family income over time reveal
Q80: You go into a grocery store to
Q80: The BEST example of a public good
Q105: A backward-bending supply curve of labor shows
Q142: Economic models that make unrealistic assumptions may
Q191: In the factor market,households buy goods and
Q256: (Figure: Production Possibilities and Circular-Flow Diagram)Use Figure:
Q271: The circular-flow diagram represents the market for