Use the following to answer question:
Figure: Demand and Marginal Revenue 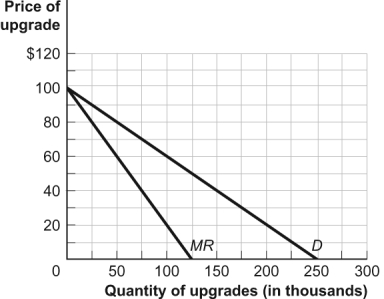
-(Figure: Demand and Marginal Revenue) Use Figure: Demand and Marginal Revenue.The figure refers to a software upgrade.The producer incurred fixed costs of $10 million to produce the upgrade;the marginal cost of allowing consumers to download the upgrade is zero.What is the efficient level of output for the upgrade?
Definitions:
Frequency Distribution
A summary of a set of data that shows the number of occurrences of each unique value or bin of values.
Cumulative Percent
Cumulative percent is a statistical term describing the percentage that a given value, or a value smaller than it, has in the total number of values in a dataset.
Arrests
Arrests refer to the act of detaining or capturing someone by legal authority based on an accusation of committing a crime.
Cumulative Percent
The percentage that represents the sum of a category and all categories that are ranked lower in a frequency distribution.
Q15: Long-run equilibrium in perfect competition and in
Q19: The proposition that,if bargaining is costless and
Q52: Suppose the federal government determines the total
Q65: The marginal cost of producing an artificially
Q69: When each factor is paid an amount
Q99: Which example is a good or market
Q108: A coal-powered electrical generator that discharges smoke
Q149: (Figure: An Individual's Marginal Benefit from a
Q154: If drivers decide to make phone calls
Q158: Lakisha's labor supply curve is downward sloping