Use the following to answer question:
Figure: The Socially Optimal Quantity of Pollution 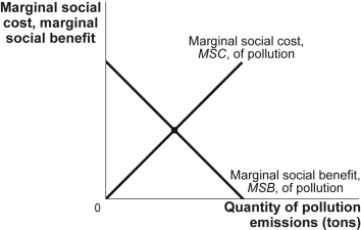
-(Figure: The Socially Optimal Quantity of Pollution) Use Figure: The Socially Optimal Quantity of Pollution.In the figure,firms are the only beneficiaries of pollution,and costs are borne solely by others in the society.The optimal level of pollution is:
Definitions:
Comparative Advantage
The ability of a country or firm to produce a particular good or service at a lower opportunity cost than its competitors, underpinning the rationale for international trade.
Job Losses
The act of becoming unemployed due to factors like economic downturns, restructuring, or automation.
Job Gains
Increases in the number of jobs available in an economy, indicating employment growth and potentially a strengthening economic condition.
Consumer Surplus
The disparity between the total price consumers are ready and able to pay for a service or product and what they end up paying.
Q94: For the United States in 2012,a Gini
Q99: The fact that firms in a monopolistically
Q108: The field of law that attempts to
Q119: (Figure: The Restaurant Market)Use Figure: The Restaurant
Q144: (Figure: Monopoly Profits in Duopoly)Use Figure: Monopoly
Q158: In a market economy,goods that are nonrival
Q159: An industry with a few interdependent firms
Q164: In the short run,a monopolistically competitive firm
Q189: There are two plants in an industry.To
Q218: (Table: Demand Schedule of Gadgets)Use Table: Demand