(Figure: The Optimal Quantity of Pollution) Use Figure: The Optimal Quantity of Pollution.The figure shows the marginal social cost (MSC) and marginal social benefit (MSB) for firms that pollute the air with sulfur dioxide.Using the figure,the optimal Pigouvian tax per unit of pollution is: Figure: The Optimal Quantity of Pollution 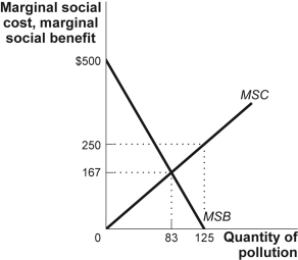
Definitions:
Domestic Currency
The currency that is legally in use within a country's borders, serving as the medium for exchange, a store of value, and a standard of account.
Exchange Rate
The value of one currency when being converted to another currency.
Base Currency
The currency against which exchange rates are generally quoted in a given country, typically the currency of the home market.
Counter Currency
The second currency listed in a foreign exchange rate transaction, which can be bought or sold relative to the base currency.
Q36: In monopolistic competition,each firm:<br>A)is a price taker.<br>B)has
Q56: In monopolistic competition:<br>A)firms may advertise to increase
Q88: In the United States,the government pays _
Q90: The welfare state:<br>A)often takes up a large
Q102: Gas stations are not monopolistically competitive because
Q106: The efficient price for a good that
Q139: (Table: Total Cost and Total Individual Benefit)Use
Q191: Which scenarios BEST describes an oligopolistic industry?<br>A)A
Q221: The failure to produce enough to minimize
Q225: Which statement is TRUE?<br>A)Once an industry has