Use the following to answer question: 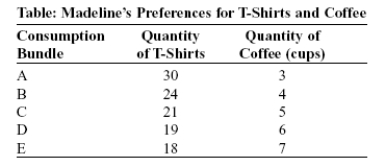
-(Table: Madeline's Preferences for T-Shirts and Coffee) Use Table Madeline's Preferences for T-Shirts and Coffee.Assume each consumption bundle provides the same level of utility.Suppose Madeline is consuming bundle A but then changes her consumption and slowly moves along her indifference curve to bundles B,C,D,and finally E.As she moves toward bundle E,she gives up:
Definitions:
Slope
A measure of the steepness or incline of a line, representing the rate at which one variable changes in relation to another.
Budget Line
A graphical representation showing all possible combinations of two goods that can be purchased with a given income and prices.
Horizontal Axis
The x-axis in a graph, typically representing the independent variable or the quantity of interest.
Production Possibilities
A theoretical model depicting the various combinations of goods and services an economy can produce, given its available resources and technology.
Q42: Mary,an avid gardener,plans to spend 8 hours
Q54: (Table: Cost Data)Use Table: Cost Data.The average
Q61: The assumption that more is preferred to
Q77: Katherine has a physics exam tomorrow.However,a free
Q78: Two goods in an individual's consumption bundle
Q80: The maintenance group knowing or having access
Q98: (Table: Lindsay's Farm)Use Table: Lindsay's Farm.Lindsay's variable
Q101: Which of the following affect the implementation
Q130: You can spend $100 on either a
Q176: When a factory closes,why is it bad