Use the figure below to answer the following questions. 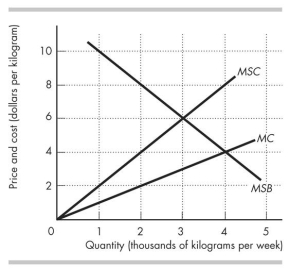 Figure 16.3.1
-Figure 16.3.1 shows the marginal private cost curve,marginal social cost curve,and marginal social benefit curve for cod,a common resource.A quota that results in the common resource being used efficiently is set at
Definitions:
Q6: Which of the following is NOT a
Q7: Which of the following are delivered after
Q23: Why might only a few firms dominate
Q27: All of the following statements are correct
Q32: One way to solve negative externality problems
Q36: The demand for a factor of production
Q47: Once a cartel determines the profit-maximizing price,<br>A)all
Q100: Table 14.2.2 gives the payoff matrix in
Q102: The income distribution in Canada is<br>A)bell-shaped.<br>B)positively skewed.<br>C)negatively
Q113: Consider the natural monopoly depicted in Figure