Use the figure below to answer the following questions. 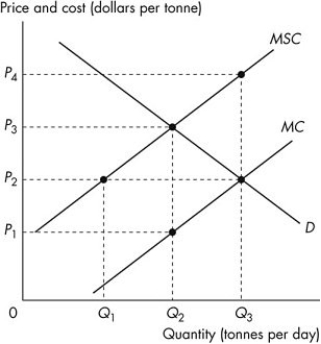 Figure 15.2.1
-Refer to Figure 15.2.1.The figure shows the marginal private cost curve,the marginal social cost curve and the market demand curve of a mining firm.If a constant per unit tax is imposed that generates an efficient allocation of resources,then consumers pay a per unit price of
Definitions:
Q15: If the wage rate increases,the income effect
Q27: An individual transferable quota is a production
Q32: Which of the following is NOT a
Q43: Dole Co.operates in a monopolistically competitive market.Which
Q55: Marginal revenue is<br>A)the change in total revenue
Q55: A four-firm concentration ratio that exceeds 60
Q66: In a natural monopoly,the long-run average cost
Q82: Refer to Figure 15.2.2.This figure shows the
Q88: Describe the criticism of traditional waterfall SDLC
Q100: Refer to Table 17.2.2.If the price of