Use the figure below to answer the following questions. 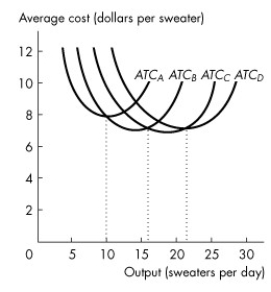 Figure 10.4.2
-Refer to Figure 10.4.2,which illustrates the short-run average total cost curves for four different plant sizes.Which curve represents the average total cost for the largest of the four plant sizes?
Definitions:
Q2: Suppose the demand for CDs is elastic,but
Q24: Refer to Figure 6.1.1.If the demand for
Q35: The paradox of value<br>A)is that values are
Q35: A firm shuts down if price is<br>A)above
Q51: Daisy and Donald live in a community
Q80: Consider an initial budget line labelled RT
Q90: Refer to Figure 13.2.2.To maximize economic profit,this
Q106: A single-price monopoly is a firm that
Q131: Refer to Figure 10.3.2,which illustrates short-run average
Q144: Which one of the following is included