Use the figure below to answer the following questions. 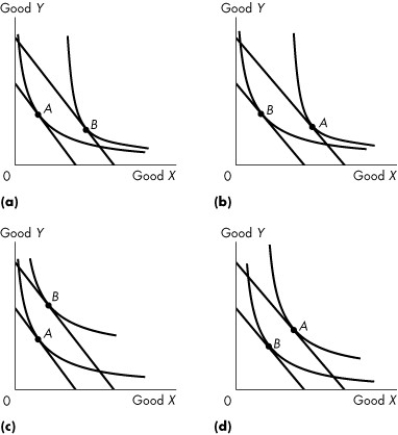 Figure 9.3.4
Original equilibrium at A,new equilibrium at B
-Refer to Figure 9.3.4.Which graphs show the case where good Y is an inferior good?
Definitions:
Interval Scales
A type of numeric scale where the order of numbers is significant and the difference between values is standardized; however, there is no true zero point.
Forecasting
The process of predicting future trends, demands, or events based on historical data and analysis.
Planning
The process of setting goals, defining strategies, and outlining tasks and schedules to achieve these goals in an organization.
Marketing Plan
A comprehensive document outlining a company's advertising and marketing efforts for a specific period of time.
Q20: When Kathryn is at her consumer equilibrium,she
Q34: Refer to Figure 10.2.1 which illustrates Tania's
Q50: The value of a good relates to<br>A)total
Q60: The goods and services we sell to
Q77: Table 7.3.1 shows the Canadian supply of
Q80: Which area in Figure 12.4.5 indicates the
Q82: When a monopoly practices price discrimination<br>A)it charges
Q94: Total cost is $20 at 4 units
Q101: An efficient allocation is achieved when<br>A)consumers are
Q110: Alvin Roth of Harvard University designed a