Multiple Choice
Use the figure below to answer the following questions. 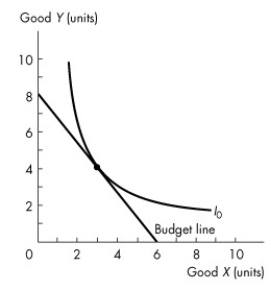 Figure 9.3.1
-Consider the budget line and indifference curve in Figure 9.3.1.At the best affordable point,the marginal rate of substitution is
Definitions:
Related Questions
Q3: Refer to Figure 13.2.6,which shows the demand
Q12: Suppose in an industry a firm realizes
Q23: Refer to Figure 11.3.5,which shows the cost
Q29: Import quotas<br>A)are the same as tariffs.<br>B)are not
Q34: Refer to Table 6.5.1.If a $2-per-unit cost
Q36: Table 6.2.2 gives the labour demand and
Q42: A country opens up to trade.In an
Q42: If the price of the good measured
Q54: When the demand for electricity peaks during
Q90: Refer to Table 11.1.1 which gives the