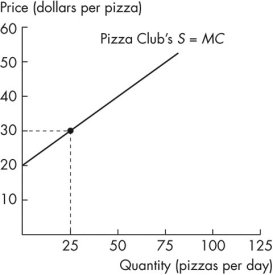
Use the figure below to answer the following questions. 
 Figure 5.2.5a Figure 5.2.5b
-Figure 5.2.5 shows the supply curve for Pizza House's pizzas in the left graph and the supply curve for Pizza Club's pizzas in the right graph.If the price of a pizza is $20,what is the quantity supplied by the market if Pizza House and Pizza Club are the only firms?
Definitions:
Interacting
The process by which two or more individuals influence each other’s behavior through verbal or non-verbal communication.
Factor Analysis
A statistical procedure used to determine the number of dimensions in a data set.
Personality Tests
Standardized tools used to evaluate an individual's character traits, dispositions, and values to understand personality.
Hypothesis
A formal prediction about the relationship between two or more variables that is logically derived from a theory.
Q3: The market for strawberries is perfectly competitive.Joe
Q27: What is the consumer surplus for the
Q27: If the marginal utilities from two goods
Q36: If the price of a good increases,everything
Q40: Marginal utility theory derives<br>A)an upward-sloping demand curve.<br>B)a
Q43: Suppose that the world price of eggs
Q82: Which of the following decreases the supply
Q91: Refer to Figure 5.2.4.If the market price
Q101: Contests do a good job in resource
Q120: Usually the imposition of trade barriers affecting