Multiple Choice
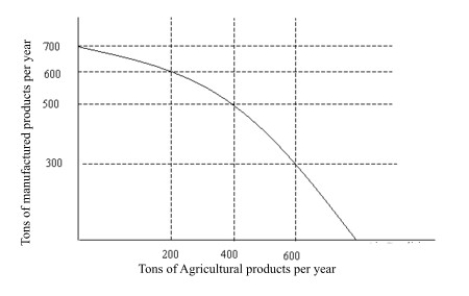 Figure 2.1
-On the production possibilities curve in Figure 2.1 the opportunity costs of increasing agricultural production from 200 tons to 400 tons is:
Definitions:
Related Questions
Q35: Refer to Table 17.2.The marginal revenue product
Q52: Figure 2.2 presents a production possibilities curve
Q71: The U.S.has a lot of both skilled
Q78: Table 3.1 illustrates Willy and Blythe's hourly
Q96: The production possibilities curve in Figure 2.1
Q148: Using figures from the Application,the opportunity cost
Q158: Refer to Table 17.1.The marginal product of
Q160: The only way individuals can cope with
Q192: If supply decreases in Figure 4.7,then the
Q220: Suppose that consumers expect that the price