The figure shows a pV diagram for 0.95 mol of gas that undergoes the process 1 → 2. The gas then undergoes an isochoric heating from point 2 until the pressure is restored to the value it had at point 1. What is the final temperature of the gas? The ideal gas constant is R = 8.314 J/mol ∙ K = 0.0821 L ∙ atm/mol ∙ K. 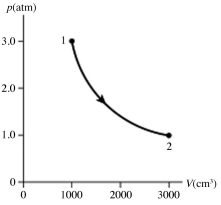
Definitions:
Sales Strategy
A plan or approach designed to promote and sell a product or service effectively, maximizing revenue and market share.
Salesperson Career Path
The progression of stages or steps a salesperson can take in their career, from entry-level positions to senior sales roles or management.
Xerox
Originally a company known for its photocopying products, the term Xerox also colloquially refers to the act of photocopying.
3M
A multinational conglomerate corporation known for its research and development of a wide range of products, including adhesives, abrasives, and personal protective equipment.
Q3: A guitar string is fixed at both
Q4: A satellite of mass m has an
Q7: An automobile engine takes in 4000 J
Q18: The compressor in a certain Carnot refrigerator
Q19: Two sources of light illuminate a double
Q26: A certain CD-ROM disk can store approximately
Q40: A man's face is 30 cm in
Q41: A simple harmonic oscillator has an amplitude
Q42: An 82.0 kg-diver stands at the edge
Q72: If <img src="https://d2lvgg3v3hfg70.cloudfront.net/TB4469/.jpg" alt="If and