Multiple Choice
A graph of the force on an object as a function of its position is shown in the figure. Determine the amount of work done by this force on the object during a displacement from x = -2.00 m to x = 2.00 m. (Assume an accuracy of 3 significant figures for the numbers on the graph.) 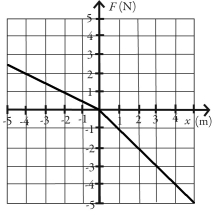
Definitions:
Related Questions
Q4: A frictionless pendulum released from 65 degrees
Q4: As the speed of a moving fluid
Q26: The entropy of an isolated system must
Q30: A 2.00-kg object traveling east at 20.0
Q33: At what temperature would the root-mean-square speed
Q45: A 0.28-kg block on a horizontal frictionless
Q45: Find the net work done by friction
Q47: How can the biomass of fungi in
Q53: The inflammatory effects of immune complexes lodged
Q63: Water flows in the horizontal pipe shown