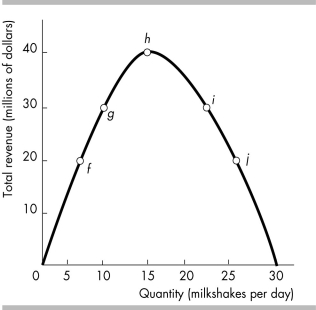
-The figure above represents the behavior of total revenue as price falls along a straight-line demand curve. Unit elasticity of demand occurs at
Definitions:
Oligopoly
A market structure characterized by a small number of firms dominating the market, leading to limited competition.
Oligopolistic Firms
Companies operating in a market structure characterized by a small number of large firms that have significant control over market prices and competition levels.
Interdependence
The mutual reliance between two or more groups, entities, or processes.
Oligopolies
Market structures characterized by a small number of firms dominating the market, where each firm has significant market power and decisions of one firm influence others.
Q88: Total revenue received by surfboard manufacturers increases
Q111: The elasticity of supply equals _ if
Q178: The figure above shows the market for
Q182: What other curve is the same as
Q224: Demand is elastic when a price _
Q230: The table above gives the demand schedule
Q354: Suppose consumers decide they value a product
Q442: The figure above shows the market supply
Q467: To maximize its revenue,<br>A) a firm facing
Q523: What is the price elasticity of demand