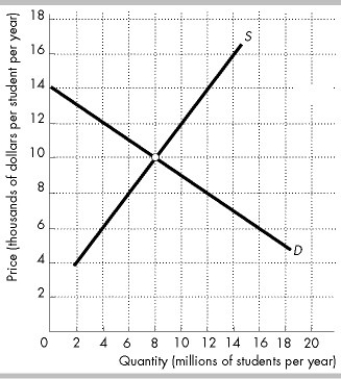
 The figure shows the supply curve (S) and the demand curve (D) for college education. The external benefit from college education is $6,000 per student per year and is constant.
-In the figure above, if the government provides a subsidy to colleges of $6,000 per student per year, how many students will be accepted?
Definitions:
Average Product
The output per unit of input, calculated by dividing total output by the quantity of inputs used.
Production Possibilities
Different combinations of goods and services that an economy can produce efficiently with its available resources and technology.
Diminishing Returns
The principle stating that as investment in a particular area increases, the rate of profit from that investment, after a certain point, cannot continue to increase if other variables remain constant.
Marginal Product
The increase in output resulting from a one-unit increase in the input of a production factor, holding all other inputs constant.
Q7: The Coase Theorem is the proposition that
Q67: A chemical factory and a fishing club
Q105: John receives a marginal benefit of $80
Q127: An example of an activity that generates
Q179: The above figure shows the marginal social
Q194: If the government assigns private property rights
Q196: The external benefit of a good<br>A) equals
Q198: Discuss the difference between a private cost
Q233: Which of the following best explains why
Q242: The table above shows the marginal costs