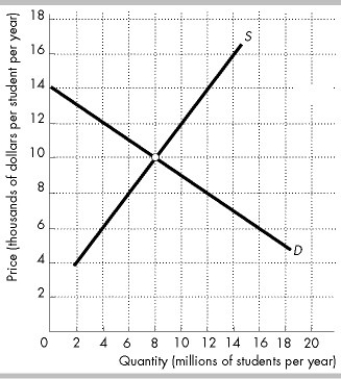
 The figure shows the supply curve (S) and the demand curve (D) for college education. The external benefit from college education is $6,000 per student per year and is constant.
-In the figure above, if the government gives a voucher equal to $3,000 per year to each college student, how many students will be accepted?
Definitions:
Operating Divisions
Operating divisions are distinct parts of a company that focus on specific areas of operation or markets, often acting semi-independently within the larger organization.
Variable Costs
Costs that change in proportion to the level of output or activity in the production process.
Fixed Costs
Expenses that do not change with the level of production or sales activities, such as rent, salaries, and insurance.
Peak-period Orders
Orders that occur at the highest volume times, often during seasonal or specific heavy demand periods.
Q40: In which of the following markets are
Q66: Refer to the payoffs in the table
Q67: What does it mean for a good
Q67: Which of the following is a distinguishing
Q80: The small town of Narberth has two
Q83: If voters are rationally ignorant, then the
Q129: Of the following, the best example of
Q144: The local banking industry currently has a
Q235: In game theory, a Nash equilibrium is
Q280: In the figure above, what is the