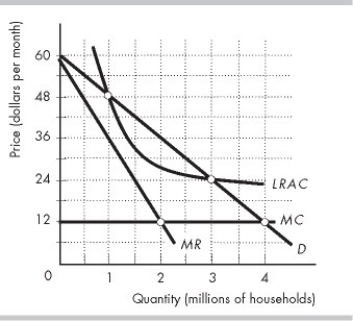
-The figure above shows the demand curve (D) faced by Visual, Inc., a cable TV company, and the firm's marginal revenue (MR) , marginal cost (MC) , and average cost (LRAC) curves. If Visual is regulated according to the social interest theory, it will serve ________ million households and set a price of ________ per household per month.
Definitions:
Goals
Targets or desired outcomes that an individual or organization aims to achieve through planned actions.
Monetary Policy Rule
Guidelines used by central banks to manage the economy by controlling the money supply and interest rates.
Economists
Professionals who study how societies use available resources to produce valuable commodities and distribute them among different people.
Money Supply
The total amount of money available in an economy at a specific time, including cash, coins, and balances held in checking and savings accounts.
Q55: What is the relationship between price, marginal
Q142: In the above table, if the firm
Q192: "Price discrimination allows a monopolist to increase
Q228: A monopolist has the demand and marginal
Q265: The above table shows the per day
Q371: In a perfectly competitive market,<br>A) each firm
Q426: All of the following are examples of
Q428: A profit maximizing single-price monopolist sets price
Q488: If a marginal cost pricing rule is
Q517: If an average cost pricing rule is