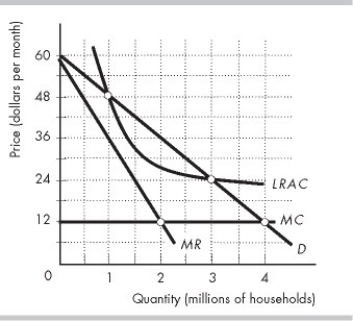
-The figure above shows the demand curve (D) faced by Visual, Inc., a cable TV company, and the firm's marginal revenue (MR) , marginal cost (MC) , and average cost (LRAC) curves. If Visual is regulated according to an average cost pricing rule, it will serve ________ million households and set a price of ________ per household per month.
Definitions:
Variable Expenses
Costs or expenses that change in proportion to business activity levels or volume, such as sales commissions or raw material costs.
Traceable Fixed Expenses
Fixed costs directly associated with specific business segments, which would be eliminated if the segment was discontinued.
Net Operating Income
The amount of income generated from regular business operations after subtracting operating expenses but before taxes and interest.
Single Product
Refers to a business strategy or condition where a company focuses on producing and selling one specific product.
Q113: The first table shows the market demand
Q127: The WaveHouse on Mission Beach in San
Q217: A perfectly competitive firm's short-run supply curve
Q221: A barrier to entry is<br>A) a natural
Q234: Rent seeking _.<br>A) increases consumer surplus<br>B) occurs
Q247: A monopoly creates a deadweight loss because
Q250: How can managers of natural monopolies exaggerate
Q278: In monopolistic competition, firms compete on product
Q367: In the figure above, the deadweight loss
Q605: When a monopoly perfectly price discriminates, there