Figure 16-3
Panel (a) Panel (b) 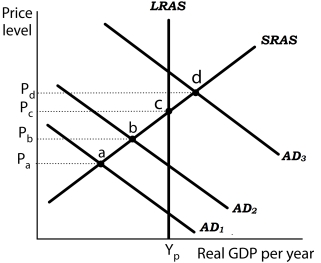
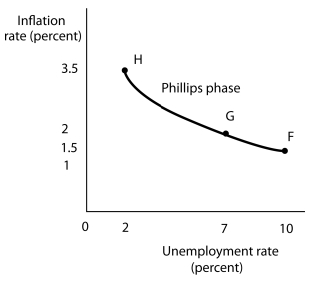 Suppose the level of potential output (YP) is $1,000 billion and the natural rate of unemployment is 5%. In Panel (a) , the aggregate demand curve in Period 1 is AD1. Assume that the price level in Period 1 has risen by 1.5% from the previous period and the unemployment rate is 10%. Thus, in Panel (b) point F shows an initial rate of inflation of 1.5% and an unemployment rate of 10%. Similarly, point b in Panel (a) corresponds to point G in Panel (b) and point d in Panel (a) corresponds to point H in Panel (b) .
-Refer to Figure 16-3. Suppose the economy is operating at point a. If policymakers Jundertake expansionary policies in period 1, what happens if there are lags in the application
Jof policy?
Definitions:
Q6: If a Phillips curve relationship between inflation
Q18: In early in 1994, the Federal Reserve
Q23: Refer to Table 14-1. If the market
Q30: Prior to the 1970s, the model of
Q31: New classical economists argue that unless people
Q71: In the not-too-distant future, according to the
Q93: A recession in foreign countries will<br>A) decrease
Q103: If a female professor receives a higher
Q122: How does the quantity of capital already
Q166: If the U.S. exchange rate increases relative