Multiple Choice
Figure 16-7 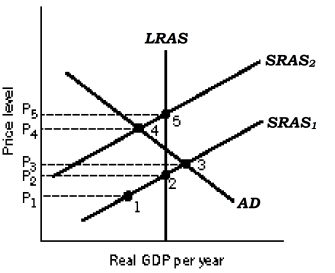
-Refer to Figure 16-7. Over time, the aggregate supply curve shifts from SRAS1 to SRAS2 Jbecause of
Definitions:
Related Questions
Q16: In the short run, a decrease in
Q27: Which of the following statements is true
Q64: Refer to Figure 17-1. During the Great
Q74: The recession in real GDP in 1970
Q75: If real GDP increases from $2,000 to
Q110: Suppose a Peruvian financial investor purchases a
Q111: The greater the difference between the Human
Q124: All of the following are possible sources
Q129: Suppose an economy is operating with an
Q193: Personal saving is<br>A) total income not spent