Figure 13-5 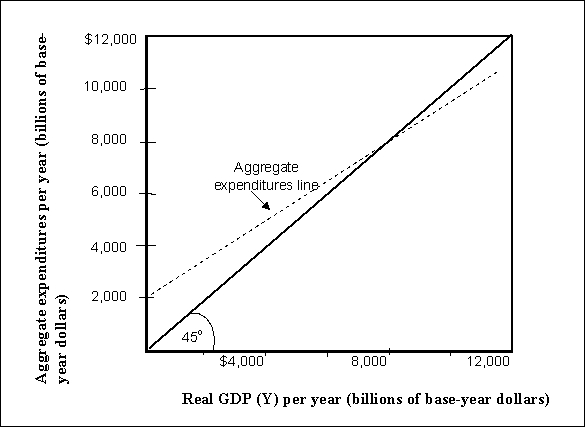
-Refer to Figure 13-5. Let Y = real GDP, AE = Aggregate Expenditures, C = Consumption, JIP = Planned Investment. Consider a simple economy where AE = C + IP, IP is autonomous
Jand the consumption function is given by C = $1,000 billion + 0.75Y. If potential real GDP is $9,000 billion, by how much must planned investment change to reach potential real GDP?
J
Definitions:
Negatively Correlated
A relationship between two variables in which one variable increases as the other decreases.
Expected Value
A calculation in statistics that quantifies the average outcome of a random event over a large number of occurrences.
Mean
The average value of a set of numbers, calculated by dividing the sum of all values by the number of values.
Risk Aversion
A preference for safer investments, avoiding risk even at the expense of lower potential returns.
Q10: Refer to Figure 15-1. Which of the
Q12: Refer to Figure 12-1. If discretionary fiscal
Q41: In the aggregate expenditures model, if aggregate
Q79: Explain how an increased money supply affects
Q83: Suppose Congress increases the corporate profit tax
Q115: A higher exchange rate for the U.S.
Q126: Suppose the economy experiences a recessionary gap.
Q131: The U.S. and Canada are major trading
Q162: Refer to Figure 15-1. An increase in
Q162: Since the late 1970s, the United States<br>A)