Figure 7-1 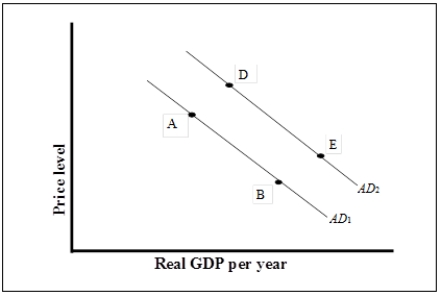
-Refer to Figure 7-1. What could have caused the aggregate demand curve to shift to the right from AD1 to AD2?
Definitions:
Monetarists
Economists who believe that variations in the money supply have major influences on national output in the short run and the price level over longer periods, as well as on inflation.
Money Supply
The overall quantity of currency and other liquid instruments circulating in an economy at a particular time.
Recession
A significant decline in economic activity spread across the economy, lasting more than a few months, normally visible in real GDP, real income, employment, industrial production, and wholesale-retail sales.
Supply-Side Economics
An economic theory that advocates for lower taxes and deregulation to stimulate production and economic growth.
Q5: Which of the following statements is true?<br>A)
Q29: Economic growth is represented by an outward
Q31: Some economists have proposed a new definition
Q36: Nominal GDP uses current market prices and
Q58: Consider a firm that produces output using
Q81: Economists define economic growth as<br>A) changes in
Q116: If the nominal GDP in 2002 is
Q163: The transactions demand for money is the
Q175: The demand curve for money curve shows,
Q193: Refer to Table 9-3. If the required