Figure 5-1 shows the path of real GDP growth over time. Use the figure to answer questions . 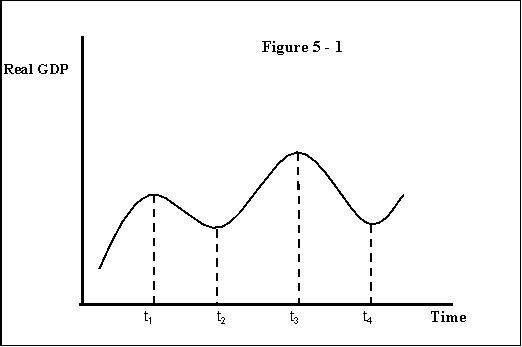
-Refer to Figure 5-1. The peak of the business cycle occurs:
Definitions:
Multidimensional Space
An abstract mathematical concept, involving more than three dimensions, that can represent complex data structures or physical phenomena.
Mean Squares for Error MSE
A measure used in statistical modeling to quantify the variance of error terms.
Predictor Variables
Variables used in statistical models to predict or estimate the value of an outcome or dependent variable.
Predictor Variable
A variable that is used in statistical models to predict or explain changes in a dependent variable.
Q39: Use the rule of 72 to determine
Q46: Which of the following is the best
Q50: Suppose labor is the only variable that
Q52: A movement along the short-run aggregate supply
Q64: Refer to Figure 7-6. Suppose the economy
Q66: Suppose in 2007, nominal GDP in a
Q70: What is a value-added tax (VAT)?<br>A) It
Q133: Refer to Table 5-7. Calculate a mechanic's
Q216: The demand for a product is the
Q221: The price of eggs might go up