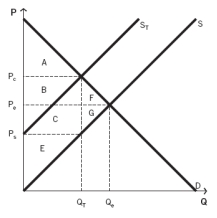
Use the following information to answer the next fifteen questions.
The following graph depicts a market where a tax has been imposed. Pₑ was the equilibrium price before the tax was imposed, and Qₑ was the equilibrium quantity. After the tax, PC is the price that consumers pay, and PS is the price that producers receive. QT units are sold after the tax is imposed. NOTE: The areas B and C are rectangles that are divided by the supply curve ST. Include both sections of those rectangles when choosing your answers.

-What areas represent the total lost consumer and producer surplus (i.e.,social welfare) as a result of the tax?
Definitions:
Physical Maturation
The process of biological growth and development in the body, typically culminating in adult physical capabilities.
Specified Stages
Distinct phases or periods in a process or life cycle that are clearly defined or identified.
Dramatic Changes
Significant and often sudden alterations or transformations in a situation, object, or entity.
Discontinuities
Breaks, gaps, or abrupt changes in a sequence or process.
Q25: In its simplest form,the long-run market supply
Q29: In a market where supply and demand
Q33: The amount you pay for insurance on
Q40: What will be the amount of government
Q53: Refer to the accompanying figure.Which area represents
Q66: All firms,no matter what type of firm
Q67: If a firm hires another worker and
Q73: What is the amount of the shortage
Q96: Negative externalities have _ for third parties.<br>A)internal
Q120: If the price of a good increases,holding