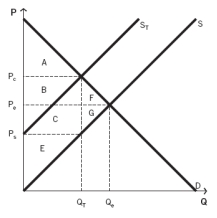
Use the following information to answer the next fifteen questions.
The following graph depicts a market where a tax has been imposed. Pₑ was the equilibrium price before the tax was imposed, and Qₑ was the equilibrium quantity. After the tax, PC is the price that consumers pay, and PS is the price that producers receive. QT units are sold after the tax is imposed. NOTE: The areas B and C are rectangles that are divided by the supply curve ST. Include both sections of those rectangles when choosing your answers.

-What areas represent the total tax revenue created as a result of the tax?
Definitions:
Good
A material item or service that fulfills wants or needs, often exchanged in economic transactions.
Equilibrium Price
The market price at which the quantity of a good or service demanded equals the quantity supplied.
Equilibrium Quantity
The quantity of goods or services that is supplied and demanded at the equilibrium price in a market.
Market
An economic system or environment where buyers and sellers interact to exchange goods and services for money or barter.
Q3: A change in quantity supplied:<br>A)is represented by
Q44: A cattle rancher and a wheat farmer
Q67: The University of California at Irvine (UCI)allows
Q73: Steve owns a bike store.His total costs
Q74: Higher input costs:<br>A)reduce profits.<br>B)increase profits.<br>C)shift the demand
Q77: Refer to the accompanying diagram.An increase in
Q92: Assume that a $0.25/gallon tax on milk
Q98: Kimberly owns a cupcake shop in Newport
Q104: Which graph would result in firms entering
Q122: If a firm's average total costs decrease