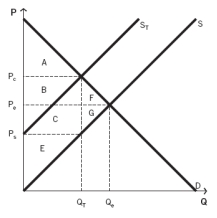
Use the following information to answer the next fifteen questions.
The following graph depicts a market where a tax has been imposed. Pₑ was the equilibrium price before the tax was imposed, and Qₑ was the equilibrium quantity. After the tax, PC is the price that consumers pay, and PS is the price that producers receive. QT units are sold after the tax is imposed. NOTE: The areas B and C are rectangles that are divided by the supply curve ST. Include both sections of those rectangles when choosing your answers.

-What areas represent the deadweight loss created as a result of the tax?
Definitions:
Benchmarking
The process of comparing business processes and performance metrics to industry bests and best practices from other companies.
Performance Evaluations
A process used by organizations to assess and review an employee's job performance and productivity over a specific period.
Benchmarking Type
Refers to the various categories of benchmarking such as process, performance, or strategic, used by organizations to compare aspects of their operations against those of other entities to identify best practices.
Strengths and Weaknesses
An assessment of the positive attributes (strengths) and limitations (weaknesses) of an individual or organization, often conducted to inform strategic planning.
Q4: If a tax is imposed on a
Q15: Which of the following can we learn
Q27: If a competitive firm can make enough
Q52: Leading economic indicators suggest that incomes will
Q61: Consider a market where production of a
Q62: Draw a perfectly competitive,profit-maximizing firm that is
Q78: The maximum amount of tax revenue is
Q119: If firms in a competitive market are
Q126: The firm is experiencing diminishing marginal product
Q127: Dave's Batting Cages is located in Boston,Massachusetts.During