Figure 15-1 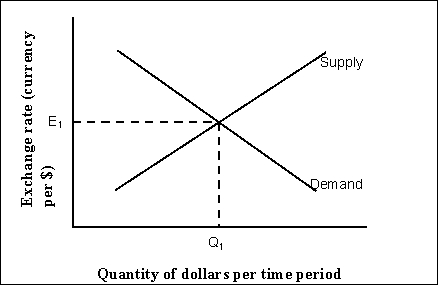
-Refer to Figure 15-1. The demand curve of dollars represents
I. U.S. purchases of imported goods and services.
II. payments to U.S. owners of foreign assets.
III. demand for U.S. Treasury bonds by U.S. residents.
IV. foreigners' purchases of U.S. assets.
Definitions:
Equilibrium Quantity
The quantity of goods or services supplied that is exactly equal to the quantity demanded at the market's equilibrium price.
Social Insurance
Programs designed to provide protection against economic risks (such as unemployment, disability, or old age) largely based on contributions that reflect a person's earnings.
Loanable Funds
The pool of money available for borrowing in the financial markets, governed by interest rates, which balance the supply of savers and the demand by borrowers.
Interest Rate
The percentage of a loan subject to interest fees for the borrower, often shown as an annual portion of the outstanding loan balance.
Q2: If the U.S. has a capital account
Q11: An increase in wealth is likely to
Q30: Refer to Figure 13-4. Let Y =
Q48: All other things unchanged, what happens if
Q65: The inability of the government to stabilize
Q79: If political freedom is a normal good,<br>A)
Q82: Refer to Figure 13-2. An equation for
Q82: In a recovery phase, a falling rate
Q127: Over the past two decades (1990-2011), the
Q193: Refer to Table 13-3. Holding everything else