The table below shows the level of GDP per capita in 1900 for four regions of the world, as well as their growth rates between 1900 and 1938. Plot this table to determine whether catch-up is likely to occur among these regions. Does growth theory explain the growth experience of these regions between 1900 and 1938? 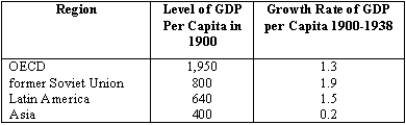
Definitions:
Q40: Nigeria's development in the last 40 years
Q44: A country located on the upper-left-hand corner
Q50: Explain the following statement: "In economics there
Q68: The equilibrium rental price of capital is
Q94: Between 1960 and 2005 Indonesia and South
Q107: Suppose a stock has the same expected
Q129: Suppose the economy is in a boom
Q139: If the marginal revenue product of capital
Q142: A constant money growth rule<br>A) leads to
Q159: When the government imposes a tariff, the<br>A)