Use the graph to answer the following questions. 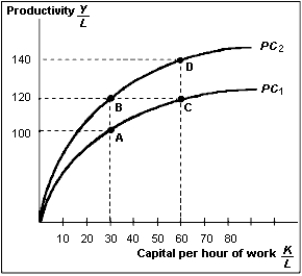 (A)Suppose that between two given years, growth in capital per hour of work and growth in technology were both positive. Pick two points on the graph that represent such a scenario.
(B)Suppose that between two given years, growth in capital per hour of work was zero, and growth in technology was positive. Pick two points on the graph that represent such a scenario.
(C)Suppose that between two given years, growth in capital per hour of work was positive, and growth in technology was negative. Pick two points on the graph that represent such a scenario. What happened to productivity in this particular case?
Definitions:
Q11: The rate of technological growth remained low
Q15: Suppose that MPC = 0.8 and MPI
Q25: If spending is greater than output, a
Q26: The Federal Reserve system is a government
Q80: Suppose that, in an attempt to reduce
Q95: Which of the following statements is true?<br>A)
Q113: What is a basis point?<br>A) One-hundredth of
Q133: President Obama's State of the Union address
Q140: The Fed runs monetary policy by adjusting
Q166: During an economic recovery, there is<br>A) a