Suppose the productivity function is given by
 .
.
(A)Draw a graph that shows the relationship between productivity and capital per hour of work. What assumption are you making about the returns to capital? Please explain.
(B)Pick an initial point on your productivity function and label the points  and
and 
(C) Fill in the four blanks in the following table.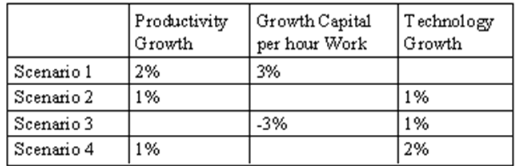
D) For growth scenario 1, label the new levels of productivity and capital per hour of work on your graph. Explain briefly.
(E)For growth scenario 3, label the new levels of productivity and capital per hour of work on your graph. Please draw a separate graph for this part. Explain briefly.
(F)For each of the four scenarios, identify whether labor and capital are growing at the same rate, whether labor is growing faster than capital, or whether capital is growing faster than labor.
Definitions:
Data
Information, especially facts or numbers, collected to be examined and considered and used to help decision-making.
Value for Y
This term does not directly correspond to a widely recognized economic concept without additional context. It may be used in specific mathematical or economic models to denote the value of a variable Y.
Marginal Utility
The change in total utility a person receives from consuming one additional unit of a good or service.
Change in Total Utility
The difference in the overall satisfaction a consumer receives before and after the consumption of an additional unit of a good or service.
Q35: To affect bank reserves and deposits, the
Q38: The buying and selling of bonds by
Q43: During a recession, the rate of inflation
Q79: The investment share of GDP is expressed
Q85: The most recent episode of hyperinflation occurred
Q85: If the government share of GDP equals
Q87: Real business cycle theories focus on changes
Q100: Innovation can best be thought of as<br>A)
Q153: The initials BEA stand for the<br>A) Business
Q170: Structural unemployment is defined as unemployment that