The shaded block in the table below shows the amount of output that can be produced using different combinations of labor and capital in a hypothetical economy with a given type of technology. For example, 1,200 units of output are produced when 75 units of labor and 75 units of capital are combined. This table is an example of a production function. 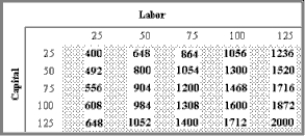 (A)Hold capital constant at 50 while you increase labor. What happens to output?
(B)Now hold labor constant at 50 and raise the level of capital. What happens to output?
(C)Finally, what happens to output when labor and capital are raised by the same amount, assuming that you start with 50 units of each?
(D)Sketch the production function on a graph that plots labor on the horizontal axis and output on the vertical axis. Assume capital is fixed at 50. What happens to the graph if capital is increased to 100?
(E)What happens to the output numbers in the table if there is an improvement in technology? What would happen to your graph in part (D)?
Definitions:
Decision Maker
An individual or group responsible for making choices that will impact the organization.
Visuals
Graphic elements such as charts, graphs, and images used in communication materials to supplement text, making information easier to understand and more engaging.
Tables
A systematic arrangement of data in rows and columns for easy reference and analysis.
Pie Graph
A circular chart divided into sectors, each representing a proportion of the whole.
Q7: Use the following data for a supply
Q9: Refer to Exhibit 2A-4. Which of the
Q45: Which of the following is not held
Q73: Explain how economic models are similar to
Q75: Other things being equal, a decline in
Q81: For the hypothetical economy described in the
Q92: In a simple economy, Wanda's Weavers grows
Q107: The nongovernment share of GDP<br>A) is, for
Q118: Which of the following would not be
Q164: Which of the following situations best explains