Refer to the information provided in Figure 7.11 below to answer the question(s) that follow. 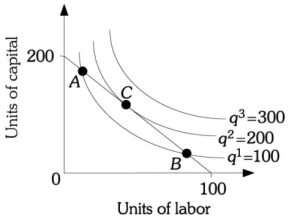 Figure 7.11
-Refer to Figure 7.11. If the firm's cost of capital is $15 per unit and its cost of labor is $30 per unit, the isocost line represents a total cost of
Definitions:
Demand Curve
A graph showing the relationship between the price of a good and the quantity demanded by consumers at those prices.
Marginal Utility
The additional satisfaction or usefulness obtained from acquiring or consuming one more unit of a product.
Market Demand Curve
A graph showing the relationship between the price of a good and the quantity of that good that all consumers in a market are willing to purchase at each price level.
Price Elasticity
The degree to which the demand or supply of a product or service changes in response to a change in price, indicating the sensitivity of consumers or producers to price variations.
Q3: Refer to Figure 5.7. The demand for
Q15: Refer to Figure 5.6. The market is
Q33: Refer to Figure 6.14. If the price
Q44: Refer to Figure 6.4. Bill's budget constraint
Q55: Refer to Scenario 7.1. Your accounting profit
Q94: Price increases cause a decrease in a
Q179: Refer to Table 6.3. The marginal utility
Q258: Refer to Figure 7.8. If the price
Q290: Assume Robbie's Robots operates in a perfectly
Q380: One formula for _ is TVC/q.<br>A) TFC<br>B)