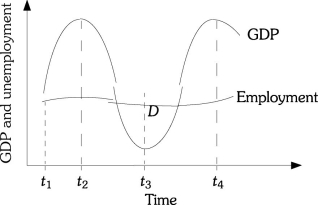
Refer to the information provided in Figure 30.2 below to answer the question(s) that follow.  Figure 30.2
-Refer to Figure 30.2. Labor productivity at time t1 is
Definitions:
Total Cost Curve
A graphical representation that shows the total cost of producing different quantities of output.
Ratio
A mathematical expression that represents the quantitative relationship between two numbers, showing how many times one value contains or is contained by the other.
Output
The total amount of goods or services produced by a firm, industry, or economy in a given period.
Average Fixed Costs
The fixed costs of production divided by the quantity of output produced, decreasing as production increases.
Q66: Refer to Figure 3.13. An increase in
Q79: All households have ultimately limited incomes.
Q167: It is difficult in economics to perform
Q205: Refer to Scenario 3.3. The mustard recall
Q209: An unexpected increase in inventories has a
Q214: The unemployment rate is<br>A) the difference between
Q237: From _ the stock market as measured
Q244: Most empirical testing in macroeconomics uses data
Q258: An increase in dividend payments will<br>A) have
Q269: Output per worker hour is known as<br>A)