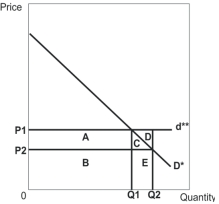
 In this diagram,D* represents the demand curve facing a monopolist and d** represents the demand curve facing a perfectly competitive firm.
-Refer to the diagram above.If both the perfectly competitive firm and the monopolist expand production from Q1 to Q2,their respective total revenues are represented by the areas __________ and __________.
Definitions:
Scientific Evidence
Data and information obtained through the scientific method, used to support or refute theories, hypotheses, and claims in various fields.
Causes
Factors or events that bring about an effect or a change, grounding the reasoning in various contexts such as scientific, social, or economic.
Consequences
The results or outcomes that naturally follow from specific actions or decisions.
Environmental Quality
The condition of the natural environment and its ability to sustain life, maintain ecological processes, and support biodiversity.
Q10: Refer to the diagram above.The difference between
Q16: Refer to the diagram above.If left unregulated,the
Q46: If economic profit is positive,then<br>A) firms will
Q76: Refer to the payoff matrix above.This game
Q93: If a per-unit tax is imposed on
Q101: A game consists of<br>A) the players,the possible
Q105: Developing a green supply chain is not
Q134: When Haynes,a Ballarat paint manufacturer,has single ownership
Q164: Suppose the diagram shown above represents the
Q233: Which of the following industries does not