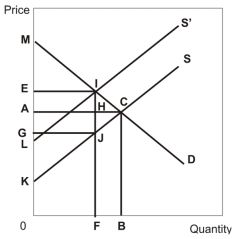
 In the diagram above,D represents the original demand curve,S represents the original supply curve,and S' represents the supply curve once a per-unit tax is imposed.
-Refer to the diagram above.The difference between the total benefit and the total cost of the trades that do not occur after the tax is the ______ and it is equal to ______.
Definitions:
Scientific Theories
Comprehensive frameworks that explain observable phenomena and predict future events, based on empirical evidence and repeated testing.
Natural Science
The study of the physical world, phenomena, and the rules that govern them, through observation and experimentation.
Well-founded Predictions
Predictions based on solid data, thorough analysis, and plausible assumptions about future events or outcomes.
New Hypotheses
Newly formulated propositions made as bases for further investigation to prove or disprove them through empirical evidence.
Q37: Refer to the payoff matrix above.Suppose a
Q42: Refer to the decision tree above.Intel will<br>A)
Q77: If the percentage change in quantity demanded
Q79: A monopolist can sell nine units at
Q135: Refer to the information above.The firm earns
Q137: A cartel is formed among the major
Q167: Refer to the graph above.If the firm
Q170: Refer to the table above.If the price
Q176: Refer to the table above.The marginal revenue
Q192: An industry that features a few firms