Multiple Choice
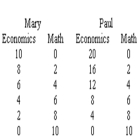
Refer to the graph below.Given Mary and Paul's production possibilities tables for answering economics and math problems,which curve represents their combined production possibilities curve if they take advantage of their comparative advantages? 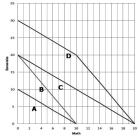
Definitions:
Related Questions
Q29: The introduction of new and more productive
Q29: Refer to the table above.The marginal utility
Q33: The moral theory in which the best
Q54: If,when the price of X increases,the demand
Q72: Teddy's production possibilities curve for goods M
Q76: Refer to the table above.Demand,between $2.40 and
Q85: According to the comparative advantage model of
Q90: The time one spends researching the performance
Q103: Moving from demand curve D1 to demand
Q152: Total revenue is<br>A) what the firm seeks