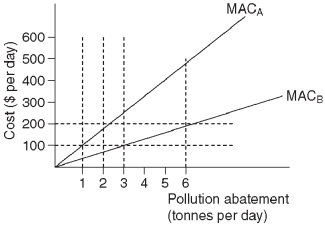
 This diagram shows the costs incurred by firm A and firm B as they reduce the pollution from their factories.MACA represents the marginal abatement cost for firm A and MACB represents the marginal abatement cost for firm B.
-Refer to the diagram above.Suppose that the government imposes a tax of $200 per tonne of pollution per day.As a result,firm A will reduce pollution by _______ tonne(s) per day and firm B will reduce pollution by _________ tonne(s) per day.
Definitions:
Inferential Statistics
A branch of statistics that uses a random sample of data taken from a population to describe and make inferences about the population.
Practice A Lot
An approach or recommendation emphasizing the importance of repeated exercise or activity to improve or master skills.
Use The Book
An instruction suggesting to refer to or consult a particular book for information, guidance, or as part of a task.
Statistical Procedures
A set of steps and methods followed to organize, summarize, analyze, and interpret data to make decisions or draw conclusions.
Q21: Refer to the graph below. <img src="https://d2lvgg3v3hfg70.cloudfront.net/TB3714/.jpg"
Q35: Which of the following is NOT a
Q87: If an event has an expected value
Q93: Learning curves (or experience curves)were first applied
Q102: If all major league baseball pitchers were
Q106: The tendency for people who expect to
Q109: Refer to the graph below.Assume that curve
Q148: A student who has paid non-refundable tuition
Q167: The marginal benefit of additional information<br>A) rises
Q168: The opportunity cost of a new national