The following data show the relationship between the number of drivers who leave for work at 8:00 a.m. ,their average commute times,and their marginal benefit associated with the commute times. 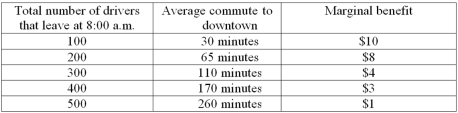
-Refer to the data above.Suppose that a toll is imposed in the following way: leaving between 8:00 a.m.and 9:00 a.m.costs $5 per driver,while after 9:00 a.m.the toll is zero.One can predict that __________ drivers will leave after 9:00 a.m.
Definitions:
Regulatory Commissions
Official bodies or organizations responsible for the control and supervision of specific industries or fields, ensuring compliance with laws and regulations.
Rate Increase
An adjustment in the price or cost of a service or product, typically an upward revision, by a company or a regulatory body.
Pricing Constraint
Factors that limit the flexibility in setting prices for products or services, including costs, competition, market demand, and regulatory requirements.
Economies of Scale
Cost advantages reaped by companies when production becomes efficient, as the scale of the operation grows.
Q32: Compared to a fixed-percentage reduction regulation,a tax
Q34: Monopsony is a<br>A) market structure with a
Q80: Given the functions for the marginal cost
Q86: The growth of Internet sites devoted to
Q87: The extra cost that results from an
Q114: To determine the best course of action,one
Q138: Which of the following describes the concept
Q158: Refer to the graphs above.In the absence
Q169: If fewer families choose to purchase dental
Q180: Which of the following behaviours is NOT