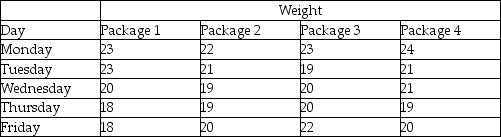
A quality analyst wants to construct a sample mean chart for controlling a packaging process.He knows from past experience that the process standard deviation is two ounces.Each day last week,he randomly selected four packages and weighed each.The data from that activity appear below.
 (a)Calculate all sample means and the mean of all sample means.
(b)Calculate upper and lower 2-sigma x-bar chart control limits that allow for natural variations.
(c)Based on the x-bar chart,is this process in control?
Definitions:
Sensitivity Coefficients
Numeric values representing the sensitivity of a dependent variable, or a portfolio's performance, to changes in an independent variable or specific market factor.
Single-Index Structure
A model used in finance to represent the returns of assets as a linear function of a single market index, reflecting the market-wide sources of risk and return.
Forecast
A prediction or estimate of future events, especially concerning weather, economic trends, or financial performances.
Evolution
The gradual development or change of something over time, often used in the context of biological organisms but also applicable to concepts and systems.
Q1: A fishbone chart is also known as
Q34: Explain how a Pareto chart can identify
Q36: Which of the following typically shows the
Q59: Most forecasting techniques assume that there is
Q63: Boeing's 737 airplane and Hewlett-Packard's printer business
Q70: La Quinta Inns has a competitive edge
Q73: The local convenience store makes personal pan
Q86: A(n)_ is a type of poka-yoke that
Q94: Big John's Manufacturing currently produces its lead
Q116: A fabrication line and an assembly line